BandwagonHost Guide
Guides
How to read detailed statistics charts for KiwiVM: CPU, network throughput, and disk I/O
Detailed Statistics allows you to track the time of usage changes, making it suitable for comparison with application logs.
Check the current price and offers before orderingView provider pricing
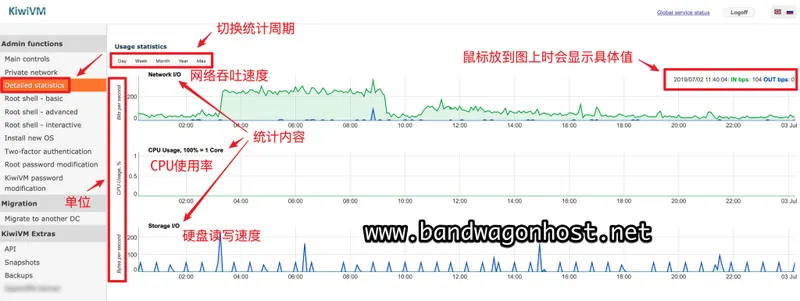
The original panel lists Network IO, CPU Usage, and Storage IO, allowing users to switch the statistical period and view specific values. The horizontal axis represents time, while the vertical axis and units change according to the selected statistical item.
If CPU usage spikes first while disk usage remains almost unchanged, the troubleshooting approach will differ from if disk and network usage spikes simultaneously. Record the peak times and compare them with logs from the same time zone; do not rely solely on a single curve to determine the cause of the problem.