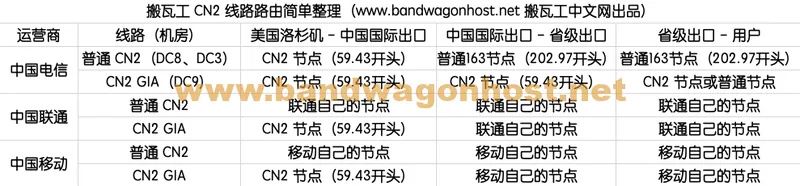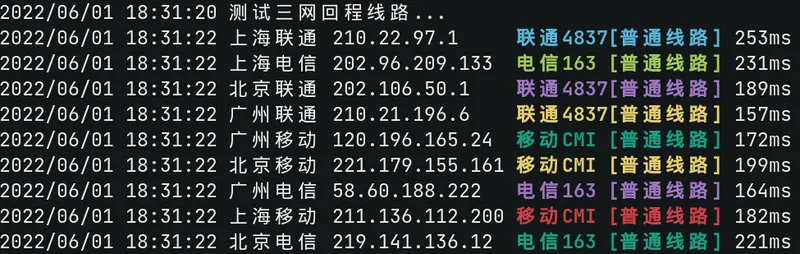
Boundaries of Backtrace Identification for Three Networks: How to Read the CN2 Tag of Backtrace
The 2022 observations grouped Hong Kong CN2 GIA, Los Angeles DC9, DC6, DC3, and Sydney AUSYD_1 into the same set of backhaul identification examples.


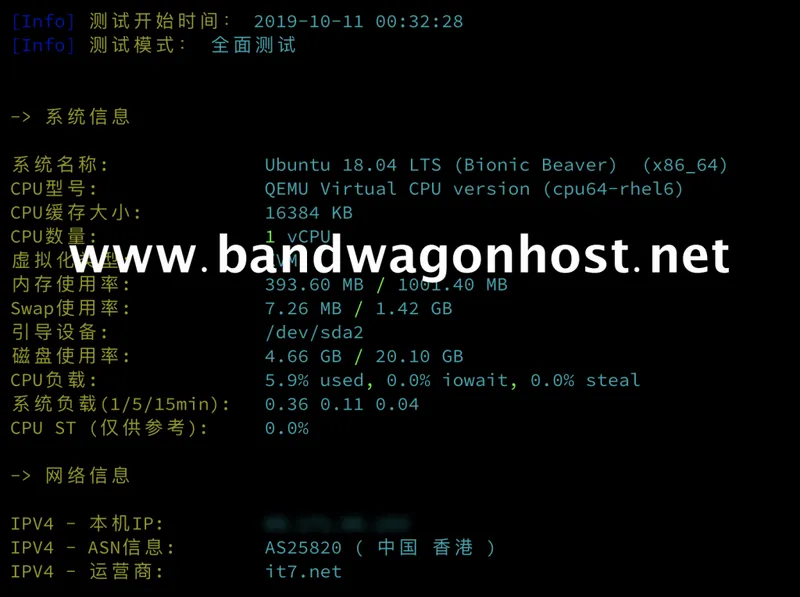
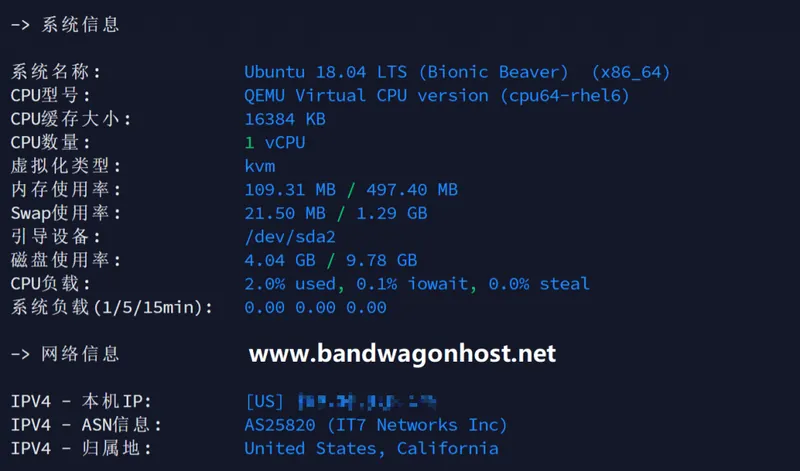
The summary separates machine performance and line measurements; some network speed samples were collected before the telecom expansion, and speed data after the expansion is also attached.
The source compiled historical speed tests from 13 data centers, with a special comparison of nodes such as SoftBank Osaka, DC3, DC8, DC2, and DC4.
The data center directory compiled at the end of 2020 lists the data center number, test address, and corresponding demo page. Some addresses come from instances owned by the original author in that data center, and some data centers do not have demo pages.
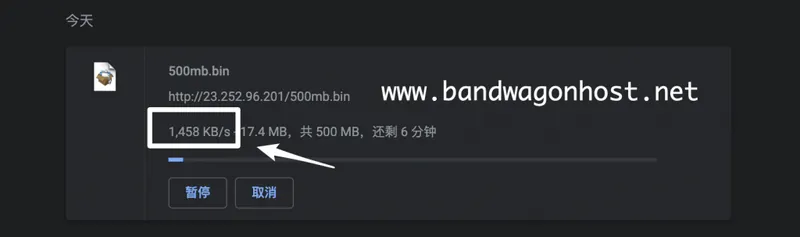
Test IPs, downloaded files, and publicly available testing tools to observe different metrics. Selecting the corresponding data center and test direction is the first step in comparing the results.
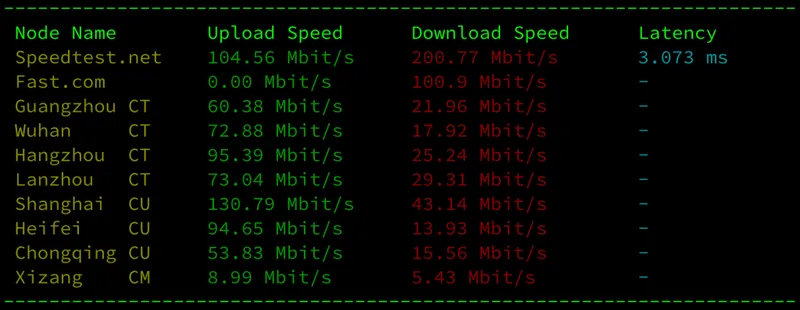
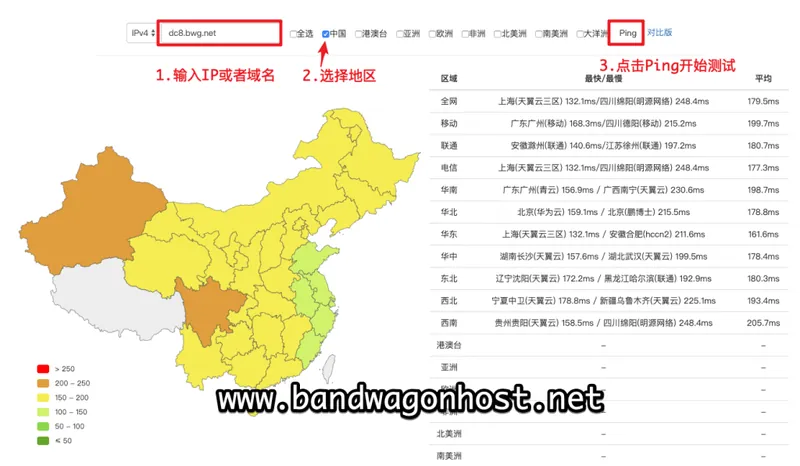
The 2020 speed test data is displayed by ISP, showing node locations, upload speeds, download speeds, and latency. Its purpose is to observe transmission differences between your own VPS and various regions in China.
In this round of evaluation, latency was collected in addition to network speed, and the fastest, slowest and average values were listed separately.
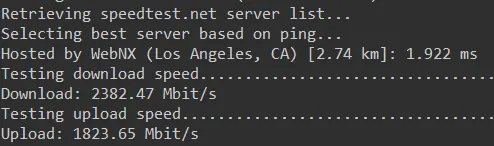
In this sample, the report recorded inbound speeds of at least 2.5 Gbps and outbound speeds of over 1 Gbps.
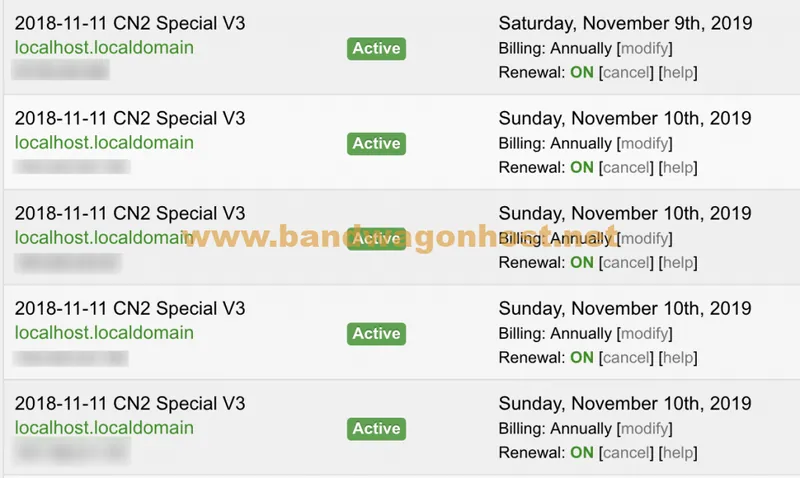
This observation focuses on the historical limited tier with an annual fee of $39.99, and separately analyzes download speed and latency.
Sampling from actual Windows, macOS, or Linux devices provides a more accurate representation of the visitor's own web experience.
When using publicly available testing points, the region, operator, and testing direction should all be noted down.
The 2019 data used Speedtest-CLI to observe the upload and download speeds from the server to the test node, and cited a case where a DC6 historical package had measured 2.5 Gbps.
The DC6 packages, compared to the source, range from 2.5 Gbps to 10 Gbps, while the DC9's historical standard package is 1 Gbps.
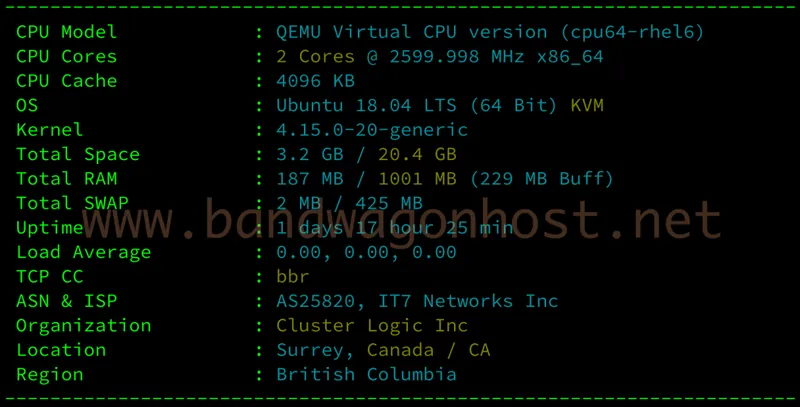
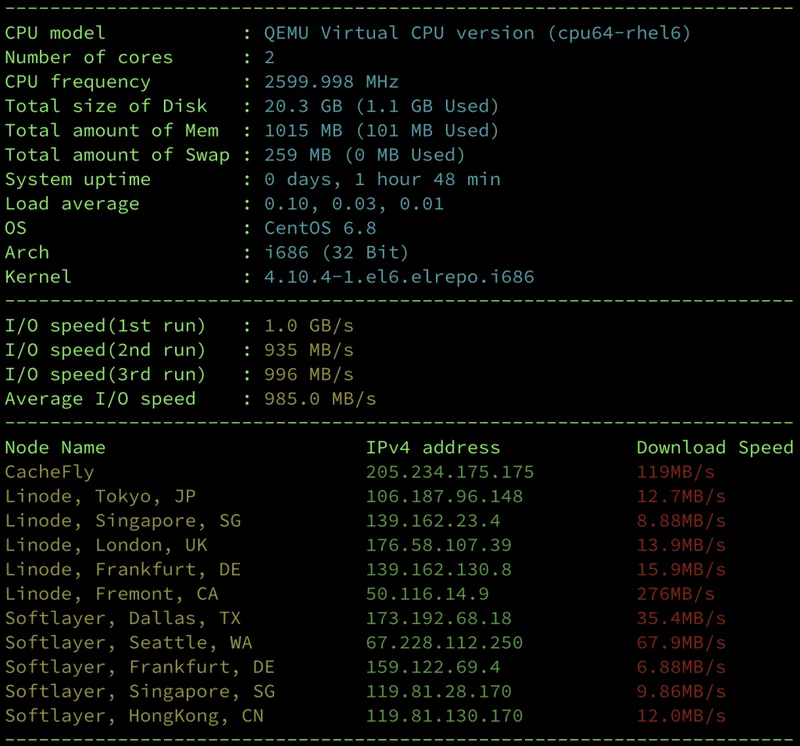
There were differences in disk read/write speeds during the retest compared to the first day of operation.
The records when the data center is put into use cover hard drive performance, file downloads, and return paths.
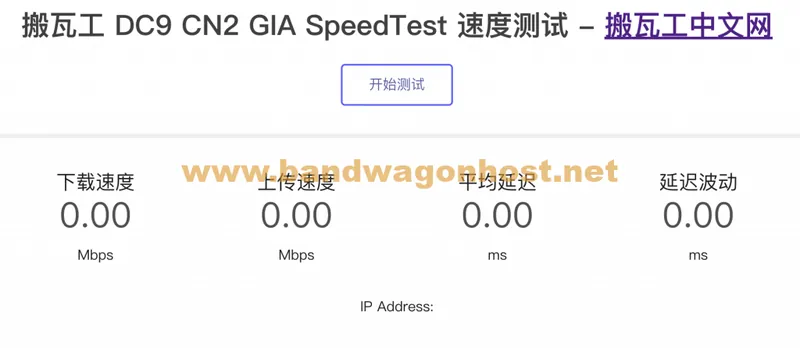
The public demo page offers different perspectives such as throughput, latency, and routing. First, select the entry point by data center.
The 2018 deployment record labeled Los Angeles DC8 as USCA_8. The source placed a demo page in that data center providing speed and line monitoring.
Network speed is commonly measured in Mbps, while file transfer speed is commonly measured in MB/s; 8 Mbps equals 1 MB/s.
The reviewer used an instance located at DC8 CN2 and collected download and return information during the evening peak hours.
This historical record is for OpenVZ solutions and includes speed, disk and backhaul information after enabling BBR.
The old data center description compares the return routes of different operators separately: In the ordinary CN2 example at that time, China Telecom used CN2, while China Unicom and China Mobile could take their own direct connection paths.
The original test record stated that the performance of the download from mainland China was limited.
The test subject is a 40G instance of GIA BETA.
The sources are listed separately as hard drive read/write, download, routing, and benchmarking.